The way digital users engage with your brand has been constantly changing in line with the market trends and what they deem convenient.
While factors like speed, zero glitches, and quick in-app movement have been constant, there are other elements such as video based content digestion, quick checkout, and focus on social-like interactions etc. that are emerging as prevalent modes for effective user engagement.
In the ever-changing digital space, although it is difficult to know for sure as to what would make users stay engaged, let us look into some mobile app usage trends we can expect to emerge and go big in 2024.
Table of contents
Mobile app usage stats predicting users behaviors in 2024
Mobile app market trends are massively impacting users’ preferences. However, the fact that users have become increasingly dependent on their mobile devices has given birth to new usage stats. Let us look into some of those mobile app industry trends.
- 88% of the time spent on mobile devices is on apps
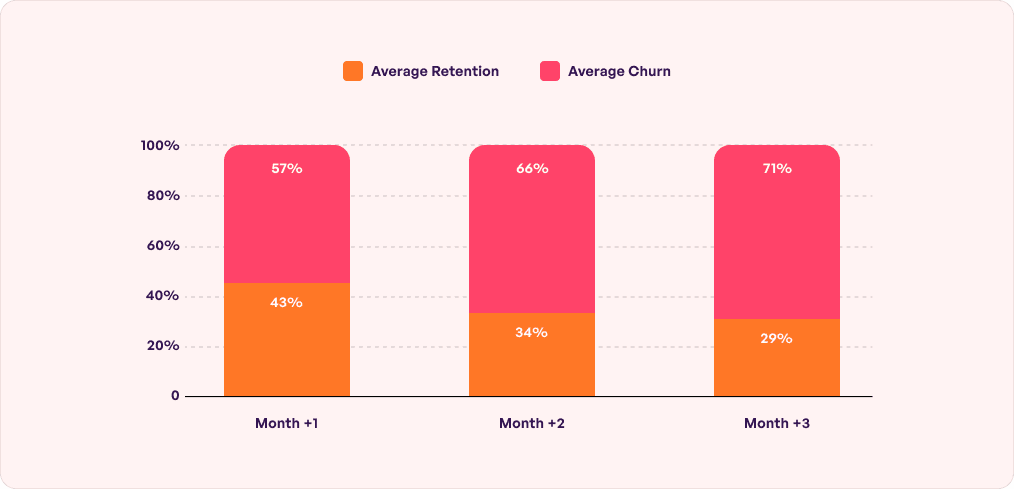
- The retention rate in Android apps is 22.6% one day from download, 6.5% seven days from download, and 2.6% 30 days after download.
- The retention rate in iOS apps is 25.6% one day from download, and 4.3% 30 days after download.
- 70% of users switch away from an app because it’s very slow.
- 67% of users leave an app if there are multiple steps to find the information or take an action.
- 49% of millennials say that they hate apps that drain their battery too fast.
- 54% of millennials have more than 3 screens of apps active on their phone.
- Social networking apps are the most popular type of app with millennials, followed by messaging apps and then games.
- 73% of millennials shop on mobile at least 4x per week.
- 70% of millennials play games daily.
While these summarize the mobile app usage stats, let us get down to the specific usage trends.
1. An average smartphone user has 80 apps on their device
Out of the 80 apps, however, they usually use only 9 while they revisit 30 apps every month. It shows that while users have multiple apps installed in their phone, they use only a limited few.
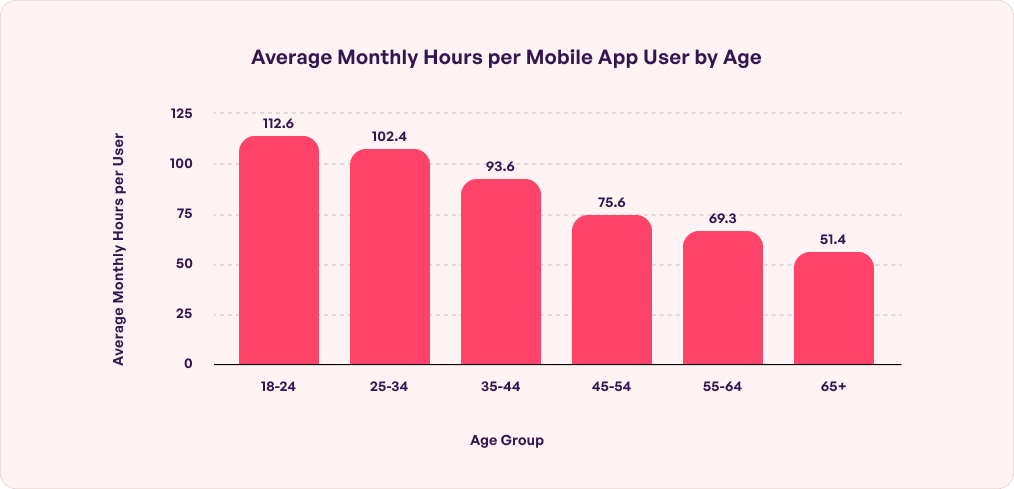
2. An average user spends 3 hours 10 minutes on mobile apps
Approximately 3 hours and 10 minutes of users go into using their mobile phones, although this number is fast growing. Even in this time range, 90% of the time goes in applications like communication, entertainment, shopping, and social media.

3. Users find apps from organic search, mobile search, and from inside the app store
Users find apps from multiple sources – from a simple Google search looking for a solution to social media and inside the app stores. What it means for businesses and their mobile app industry growth journey, is that they will need to work on a keyword-rich strategy for promoting their application on all these avenues.
4. Mobile app ads are still relevant
Mobile users have been recorded to recall app ads 47% of the time, which slightly falls to 46% in case of mobile web ads and then 36% for desktop advertisements. Additionally, mobile applications which use mobile ad networks for monetization can be expected to grow by 60%.
5. Mobile eCommerce market is expected to reach US$ 5,867.1 Billion by 2028
One of the recurrent mobile app market statistics is the role that they play in eCommerce. Approximately 69% of the users look for reviews and product price before approaching any in-store employee. Out of them it was found that 55% are looking for specifications. Moreover, 50.9% of shoppers use their phones for buying products at least once in a week.
6. 83% smartphone users use their phone in the washroom
Another key mobile app users statistics would be to know the location people choose to access their app from. While 91% of the users use apps at home, 83% access them from their washrooms and 72% use them while at work. The activities vary from watching videos, streaming music, accessing social media apps, and using productivity apps.
7. Only a few app categories are making it to the frequent list
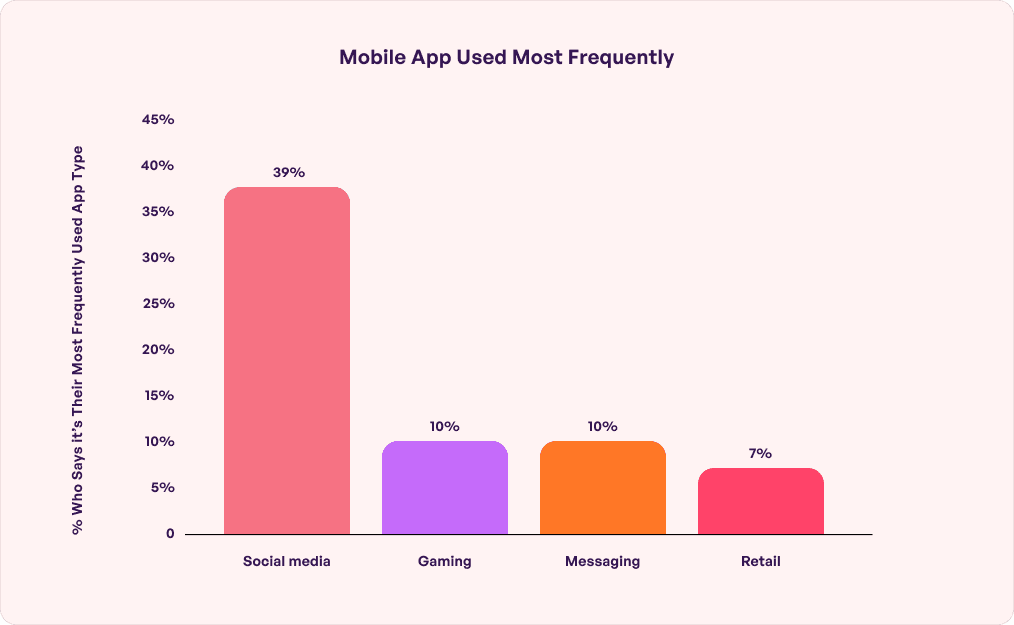
Four app categories are dominating the list of being the most frequented by the users – Social media by 39%, Gaming and Messaging by 10% each, and Retail at 7%. Other app domains that are slowly coming up to speed in the mobile app download statistics are – communication, music, entertainment, and eCommerce.

8. Gender equation in mobile apps usage
The way men and women use mobile applications vary greatly in the context of categories. Here’s a table with division wise numbers. The idea behind these mobile app statistics is to help you with the right marketing plan, one that would attract the gender that is most likely to use the app category.
| Apps | Men | Women |
| Gaming | 37% | 35% |
| Social | 27% | 22% |
| Music | 23% | 25% |
| News | 7% | 5% |
| Travel | 4% | 10% |
| Utility | 3% | 3% |
9. In turn of experience, users are giving businesses $935+ billion in revenue
In 2023 alone, mobile applications are estimated to generate over $935 billion through paid app downloads and in-app advertising. While time and again it has been established that Apple generates more revenue compared to Android, in terms of category gaming seems to rule the space with $173.60 billion in 2023.
10. Apps are leading in the mobile apps vs mobile websites discussion
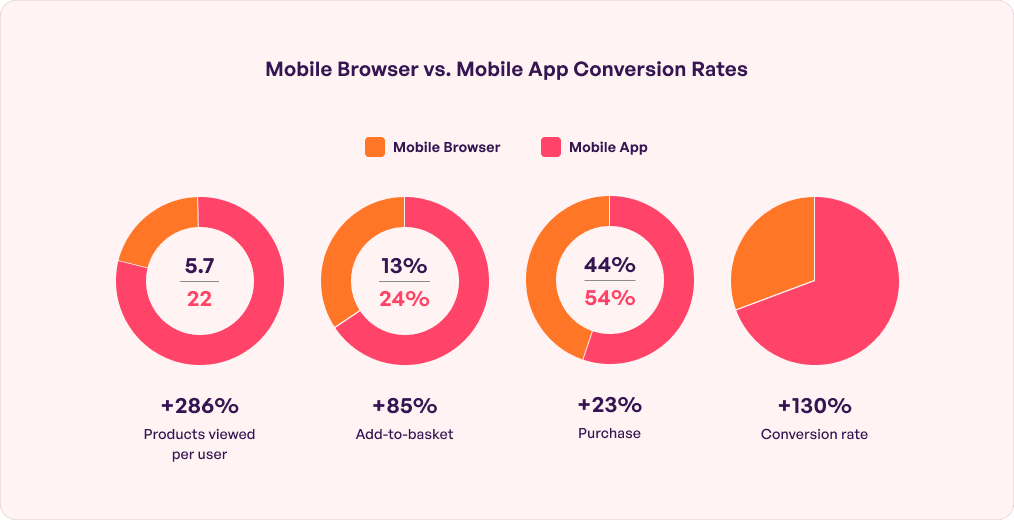
Owing to more features, faster speed, better user experience, and convenience, mobile applications are garnering a lot more attention compared to their web counterparts. Some percentages around the statement are – conversion rate on apps are 3 times higher than mobile websites, users see 4.2 times more products in a session on apps than mobile websites, and the applications average 157% higher conversion rate than websites.

11. 56% of mobile apps get uninstalled in 7 days
High app uninstallation rate remains a constant issue for app entrepreneurs who are looking to make it big in the space after putting in their money and time-based efforts. Here are some mobile app usage stats explaining why users tend to uninstall applications
- 50.6% users uninstall apps if it takes up a lot of memory space
- Complex registration
- Privacy and security issues lead to 29.6% of uninstalls
- 71% users uninstall apps because of persistent notifications
- 62% will remove the app because of performance issues.
12. An average app loses 77% of its daily active users

Retaining users, as an activity, is considered a lot more critical than finding new users. Knowing the mobile app usage statistics specific to retention will help you make sound decisions around prevention strategies.
App size is known to play a critical role in retention with 50% of users uninstalling apps that take a lot of memory space. This is the reason why businesses are now preferring to invest in PWA or Lite versions of mobile app development services. In terms of app categories, eCommerce and social networking apps are known to have maximum retention rates.
The mobile app industry statistics mentioned here are only the surface level reflection of the domain, there are a number of other mobile app market trends prevalent and emerging in the market.
As a business, it can get difficult to keep up with these numbers. In our role as a trusted mobile app development company, what we focus on is building something that is valuable to the end users, since the experience you provide supersedes mobile app future trends. However, we also carry an expertise in making your application future-ready by backing it up with features and experiences that are becoming organic to the users.
Experience the merger of time-tested robustness and future-forward functionalities by partnering with us. Get in touch with our team of business analysts today.


